Financial FAQs
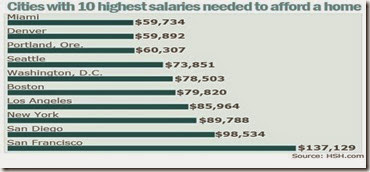
How much salary do you need in order to afford the principal and interest payments on a median-priced home in your metro area? To find out, HSH.com, a mortgage data service, took the National Association of Realtors’ first-quarter data for median home prices and HSH.com’s first-quarter average interest rate for 30-year, fixed-rate mortgages to determine how much of your salary it would take to afford the base cost of owning a home--the principal, interest, taxes and insurance--in 27 metro areas.
Graph: HSH
The good news is that conforming 30-yr fixed rates are now down to 3.875 percent for a ½ origination point in California. The Hi-Balance conforming 30-yr fixed rate is now 4 percent with a ½ pt. origination fee.
Residents of the five cities that need the lowest annual salary to afford a median-priced home were: Cleveland ($29,788), Pittsburgh ($30,177), St. Louis ($31,275), Cincinnati ($31,850) and Detroit ($32,250). The five least-affordable cities were: Boston ($79,820) Los Angeles ($85,964) New York City ($89,788), San Diego ($98,534) and San Francisco ($137,129).
Unfortunately, HSH used very conservative debt-to-income (DTI) ratios to arrive at these numbers, making them seem more sensational that they really were. HSH used standard 28 percent "front-end" debt ratios, and a 20 percent down payment taken from the NAR’s median-home-price data to arrive at their figures, said the blog. But Fannie Mae allows up to 45 percent for all debt, and even 50 percent DTI, in some cases, so that homes even in the most expensive cities don’t require such high salaries.
A buyer can in fact own a home that is 160 percent higher than the median prices with the same income, or conversely, instead of the $137,150 annual salary, it can be as low as $103,000 per year with San Francisco’s $679,800 median price, if no other debt obligations.
This is while April total existing-home sales, which are completed transactions that include single-family homes, townhomes, condominiums and co-ops, rose 1.3 percent to a seasonally adjusted annual rate of 4.65 million in April from 4.59 million in March, but are 6.8 percent below the 4.99 million-unit level in April 2013.
Total housing inventory at the end of April jumped 16.8 percent to 2.29 million existing homes available for sale, which represents a 5.9-month supply at the current sales pace, up from 5.1 months in March. Unsold inventory is 6.5 percent higher than a year ago, when there was a 5.2-month supply, which is slowing those price increases.
Homes are still affordable, even in the highest-priced cities, in other words. But it’s no surprise those are the coastal cities that also have the most robust economies.
Harlan Green © 2014
Follow Harlan Green on Twitter: https://twitter.com/HarlanGreen


No comments:
Post a Comment